Web Interface Introduction
This guide provides an overview of the YuLan-OneSim frontend interface features and functionality.
Navigation Guide
1. Scenario Entry & Model Configuration
When you launch the web UI, you land on the starting page for all simulations. Here, you can describe a new scenario using natural language or select a pre-built one.
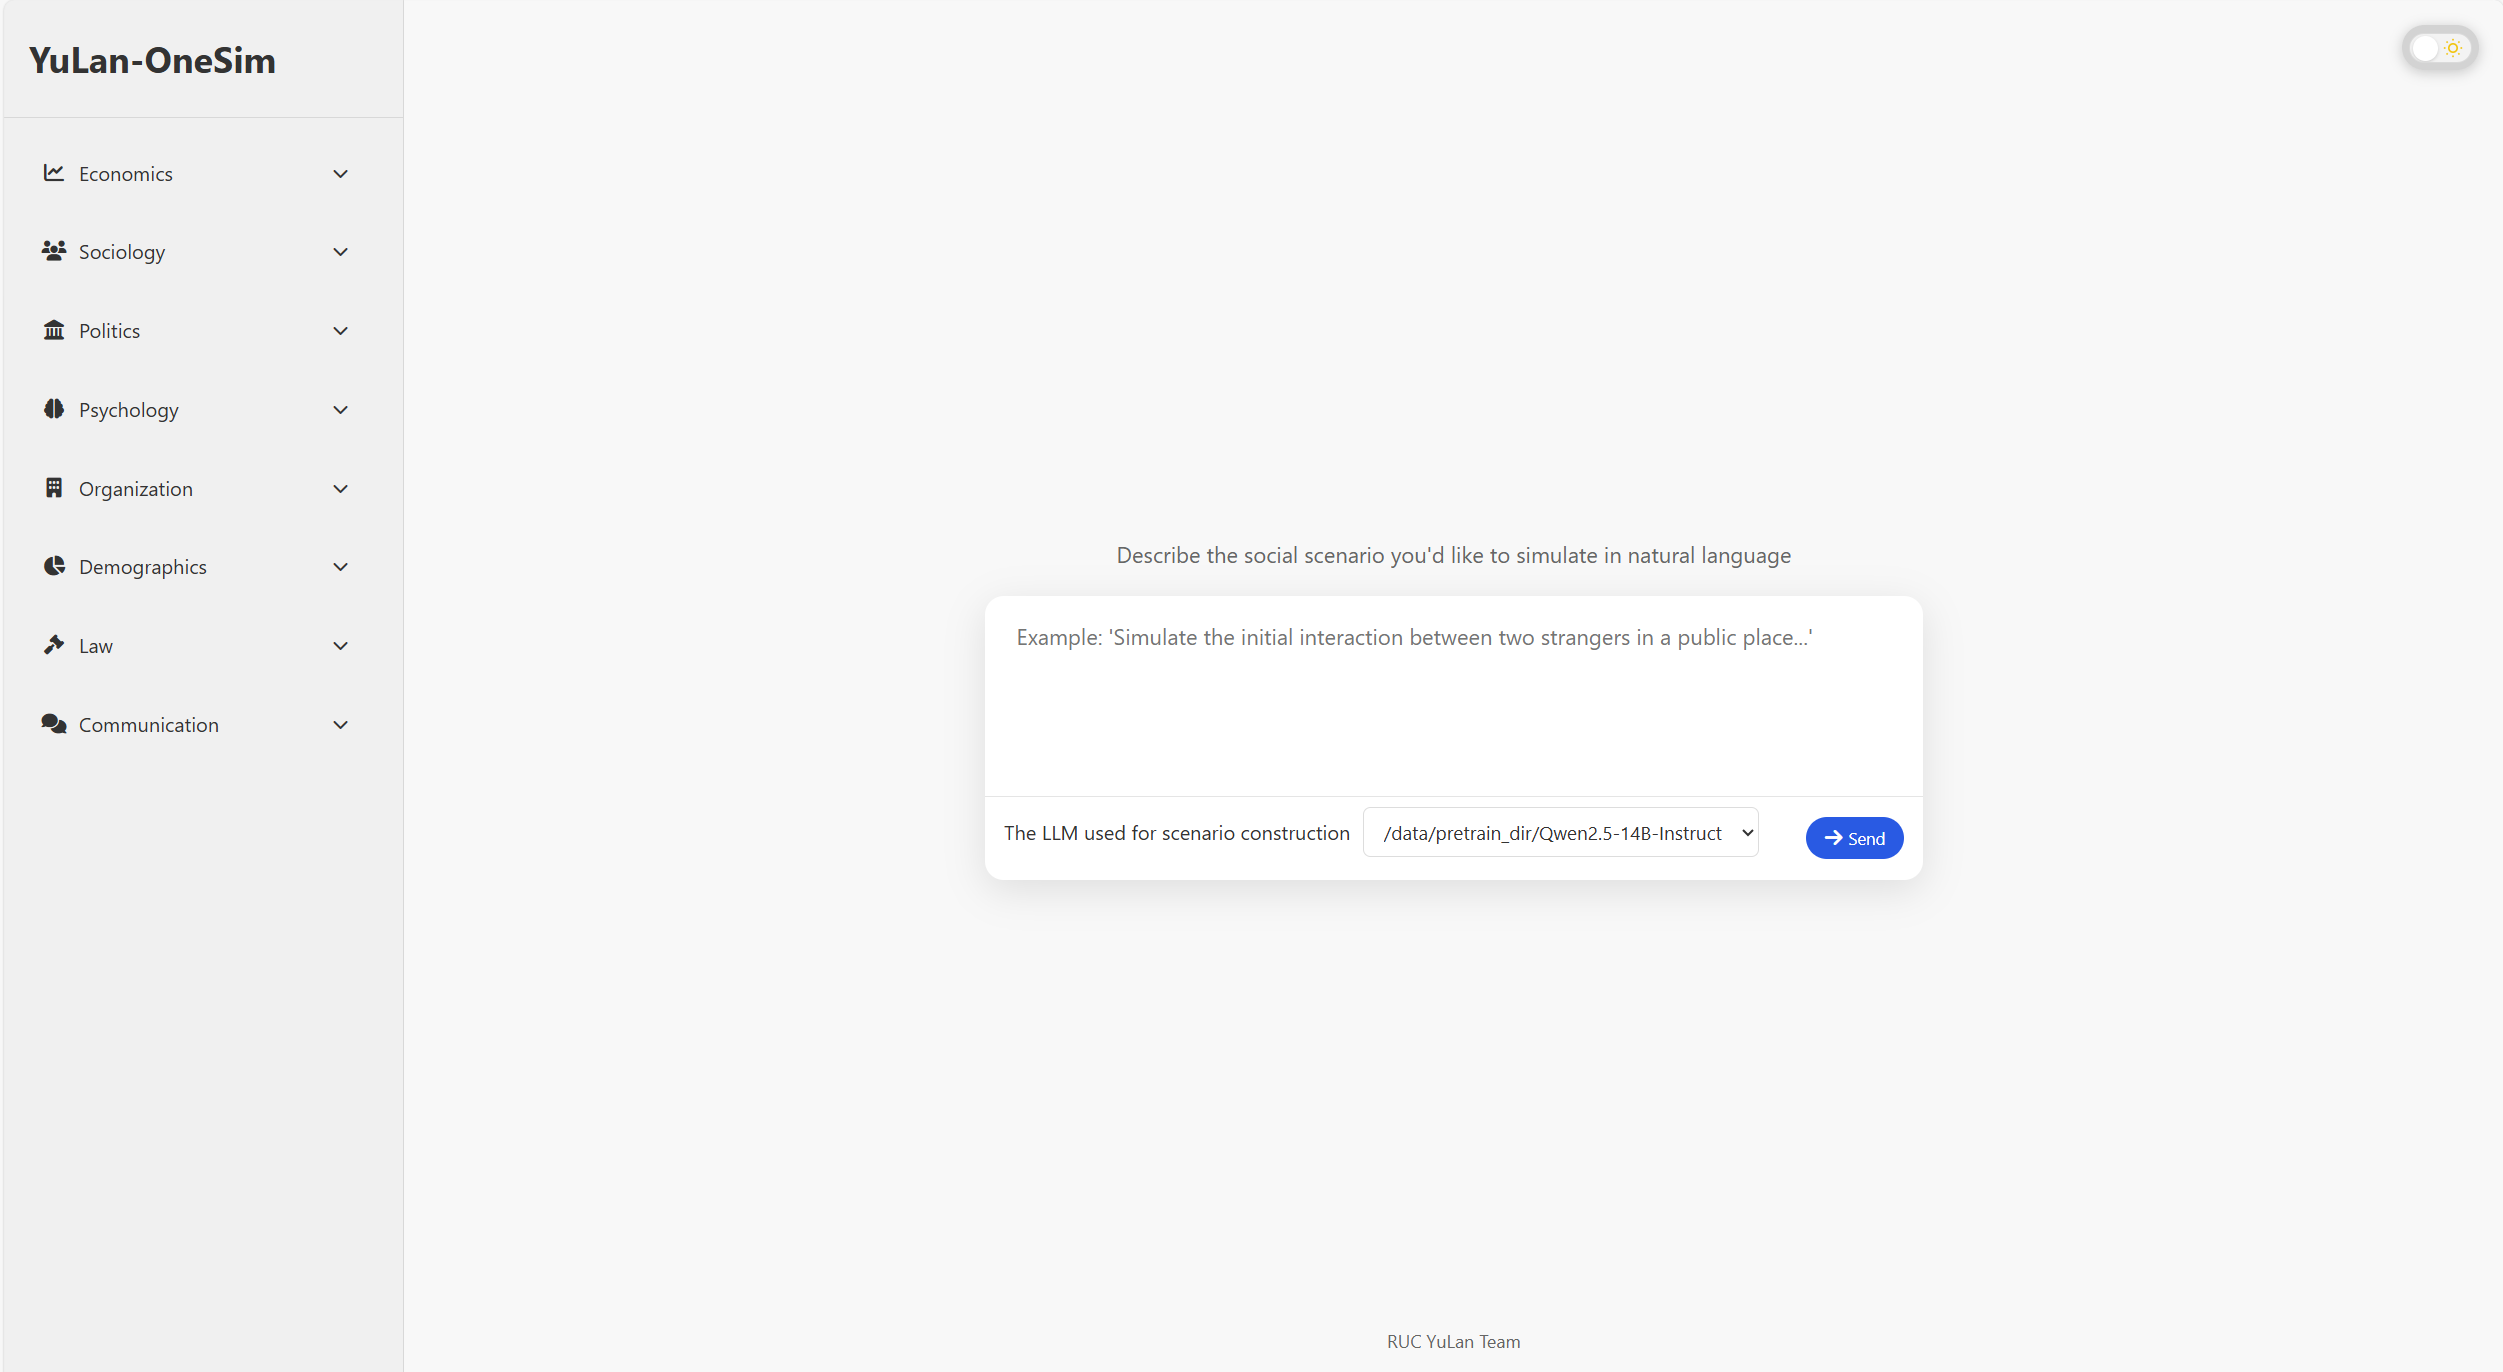
- Prompt Input: This is where you compose and submit your scenario description.
- Model Selection: Choose the large language model (LLM) you want to use for generating the scenario's code and logic.
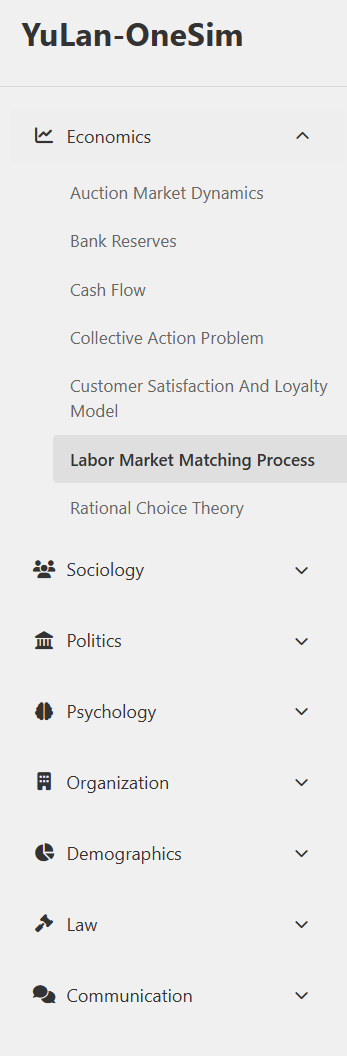
Domain Sidebar (Left Panel)
The collapsible sidebar on the left contains thematic domains (e.g., Economics, Sociology). Selecting a category can load relevant scenario templates or pre-fill prompts to help you get started.
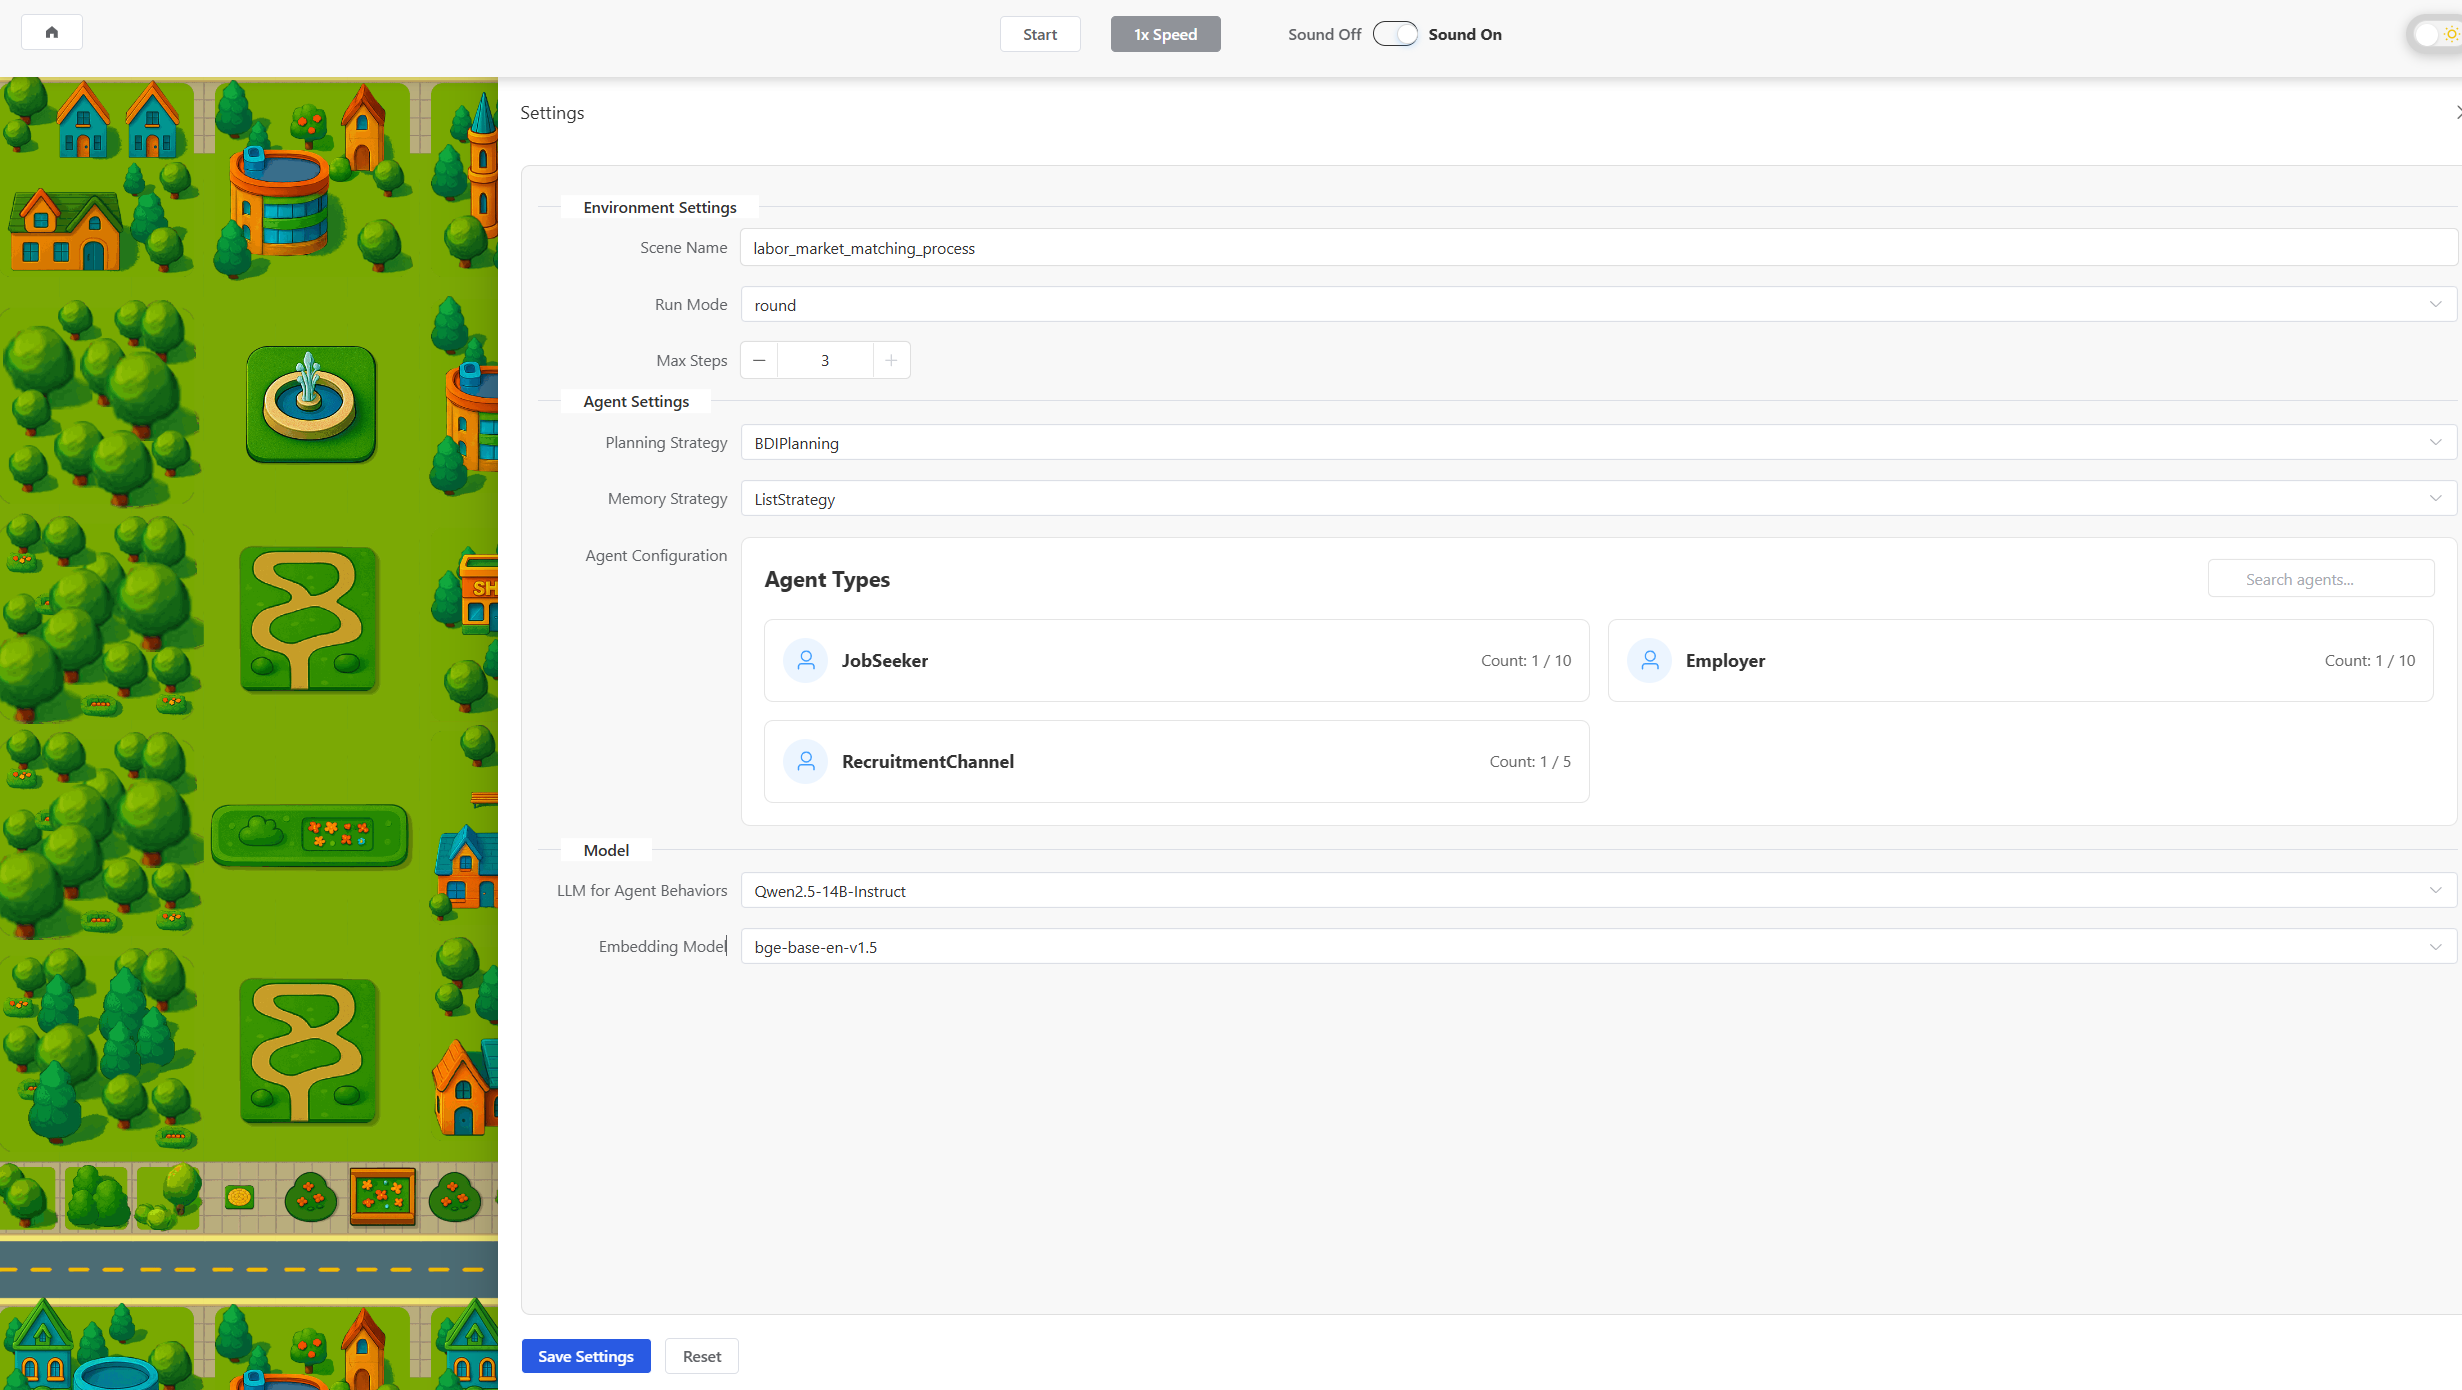
2. Settings
On the settings page, you can choose the strategies and models for the simulation run itself. Once configured, click "Save Settings" and "Start" to begin the simulation.
3. Simulation Runtime & Map View
Once the simulation starts, you are presented with an interactive dashboard.
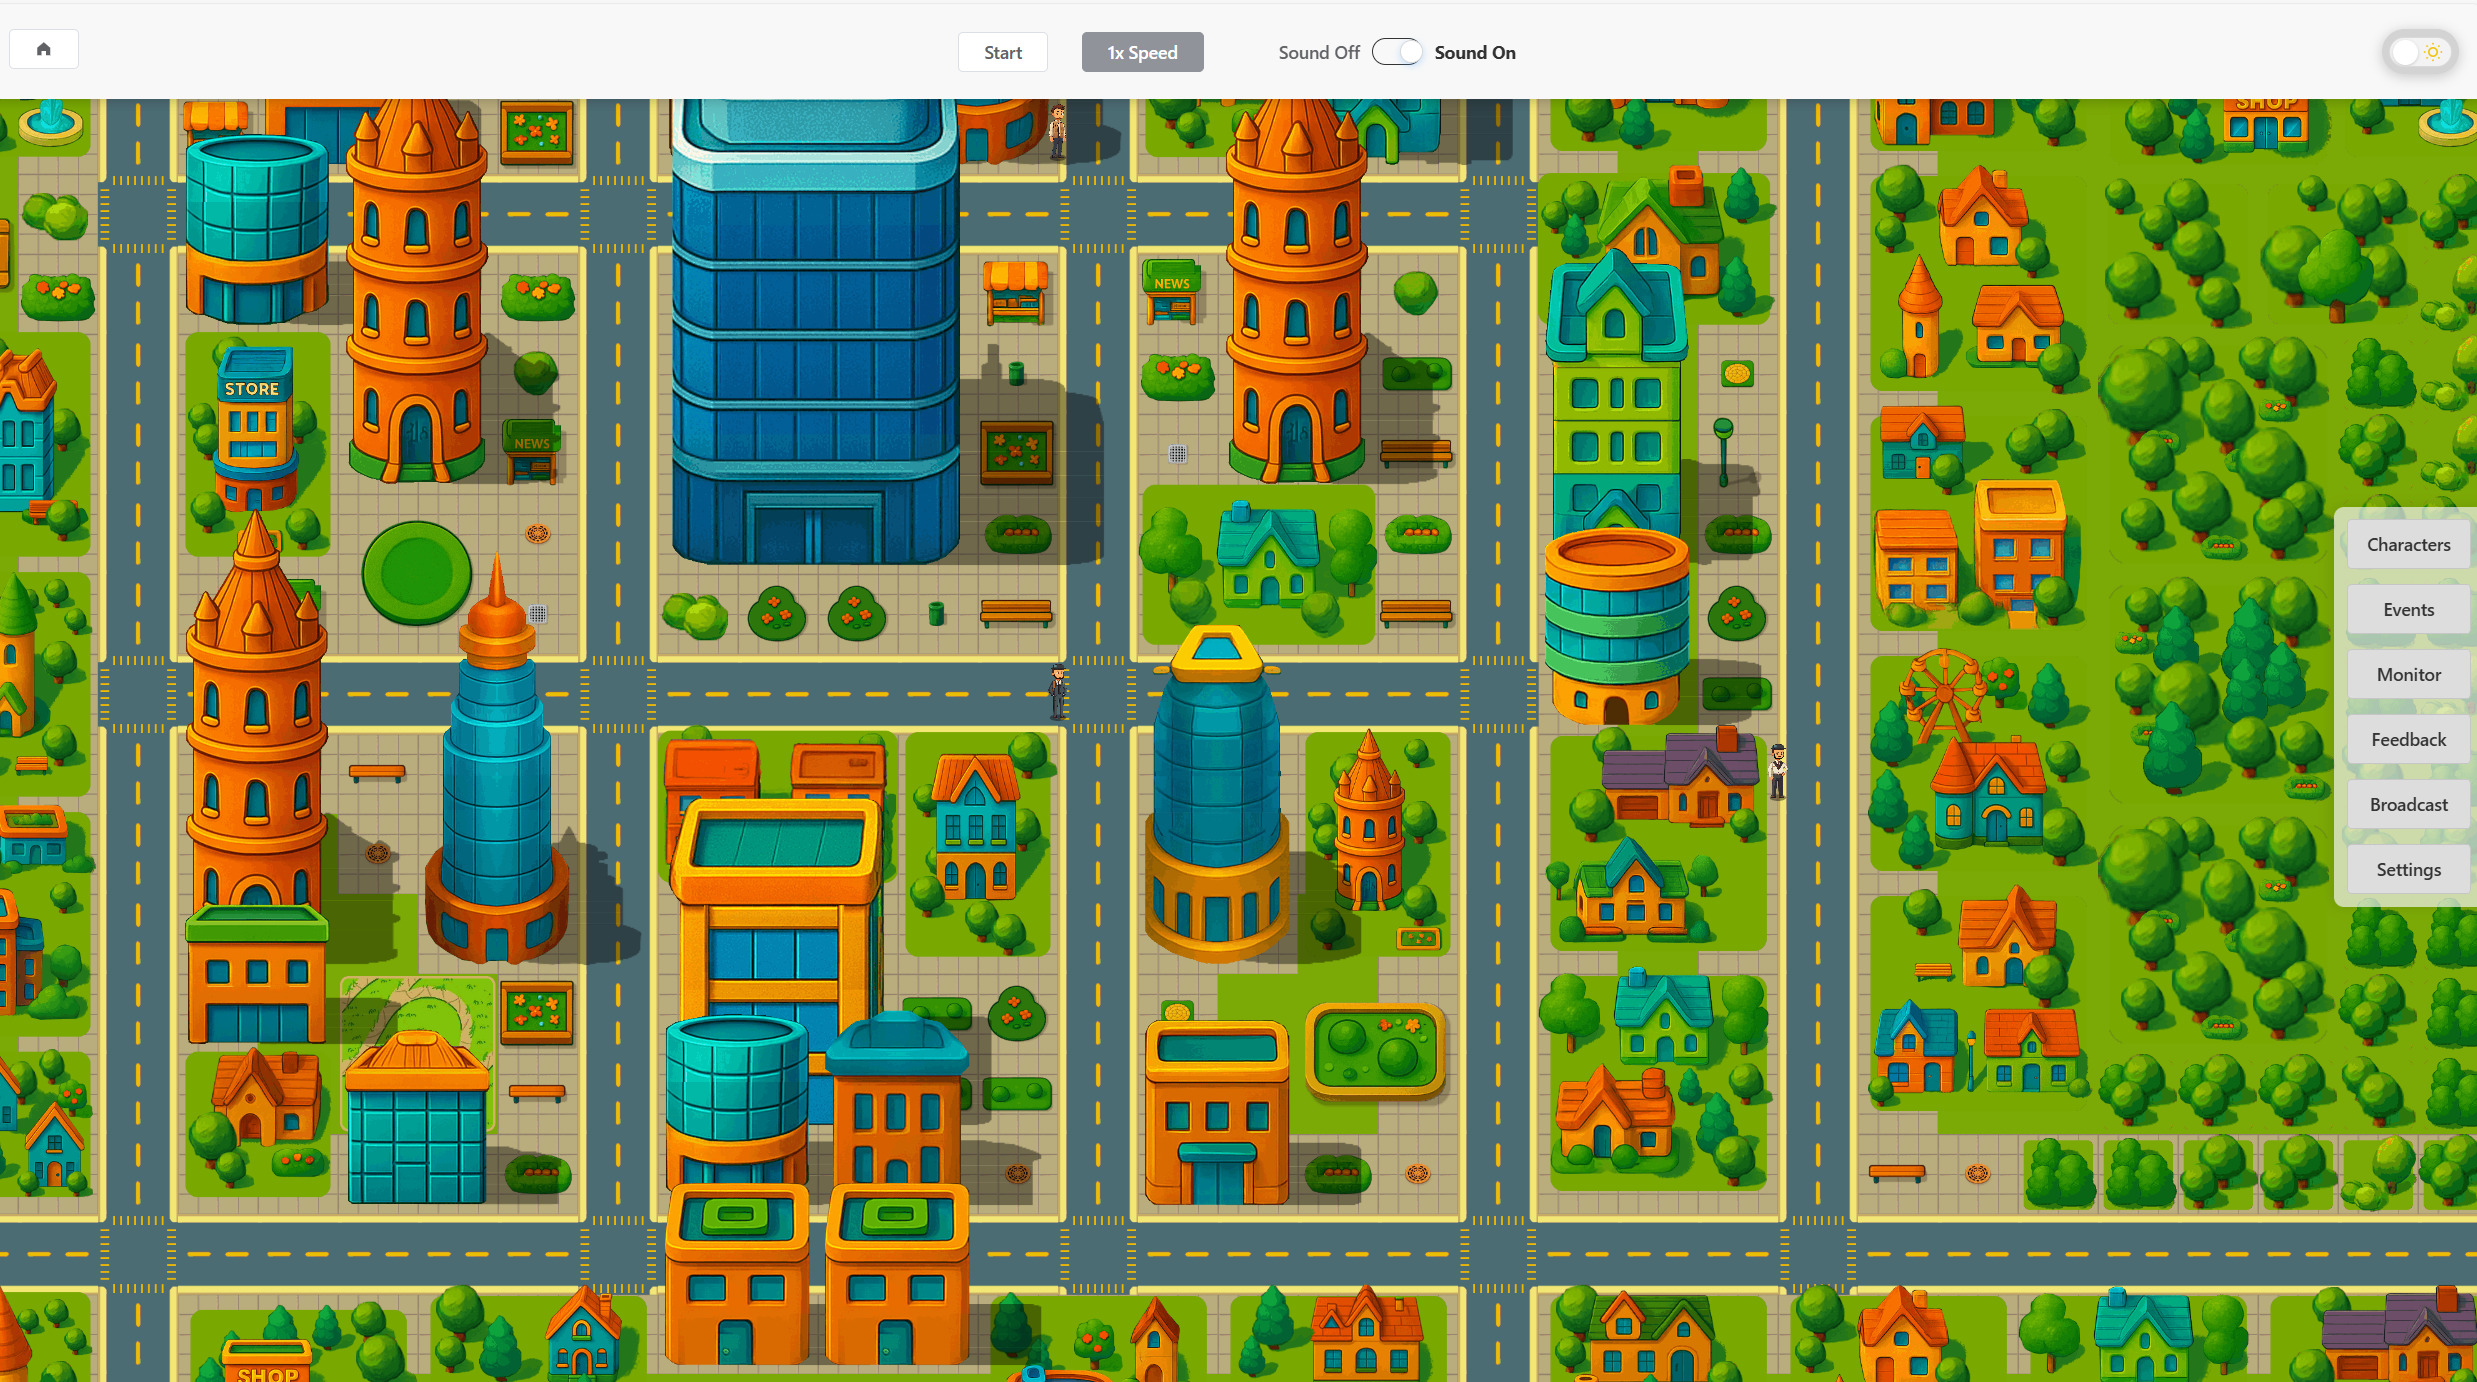
City Map Visualization
The central part of the screen features a colorful, grid-based map. It displays buildings, roads, and agents moving in real time, allowing you to observe spatial interactions and patterns as they emerge.
Simulation Controls (Top Bar)

The top bar contains the main simulation controls:
- Resume/Pause: Control the flow of the simulation.
- Speed Adjustment: Speed up or slow down the simulation to observe events at your desired pace.
- End Simulation: Stop the current run.
- Sound Toggle: Enable or disable sound effects.
4. Right-Side Function Panel
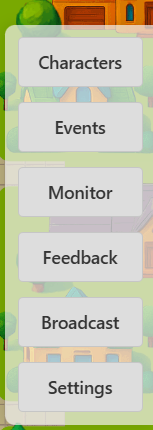 The panel on the right provides quick access to core modules for monitoring and interacting with the simulation in real time.
-
Characters: This tab displays a list of all agents currently active in the simulation. You can click on an agent to view their detailed profile, including their current state, attributes, memory, and recent actions. This is invaluable for tracking and understanding individual agent behavior.
-
Events: The Events tab shows a real-time, filterable log of all significant events occurring in the simulation. This includes agent actions, state changes, and interactions between agents. It provides a granular, step-by-step view of the simulation's progression, which is essential for debugging and analysis.
-
Monitor: The Monitor provides a high-level dashboard with charts and graphs visualizing key metrics. These metrics are specific to the scenario and can include economic indicators (e.g., unemployment rate), social statistics (e.g., public opinion), or epidemiological data (e.g., infection rates). This allows you to assess the overall state and trends of the simulation at a glance.
-
Feedback: This feature allows you to provide feedback on the simulation's performance or unexpected outcomes, which can be useful for iterative development and improving the underlying models.
-
Broadcast: The Broadcast function is a powerful tool for runtime intervention. It allows you to send a message or trigger a new event that affects all or a subset of agents. This can be used to introduce external shocks (e.g., a policy change, a natural disaster) or new information into the simulated environment to observe how the system adapts.
-
Settings: This tab allows you to view and, in some cases, modify simulation settings on the fly. This might include parameters like simulation speed, visualization options, or other configurable aspects of the environment.